In today’s interconnected global economy, the International Monetary Fund (IMF) often positions itself as a lifeline for struggling nations. But beneath the surface of “financial rescue packages” lies a controversial reality: IMF programs frequently pave the way for multinational corporations from the Global North to exploit resources in the Global South. This dynamic exacerbates debt traps, boosts corruption, and widens inequality gaps.
The Evolution of IMF Interventions:
The fall of the Soviet Union in 1991 marked a turning point. As Eastern Europe opened up, the IMF’s playbook of liberalization, privatization, and deregulation became a global standard. This “support” extended to resource-rich countries in Africa, Asia, and Latin America, promising economic growth through foreign investment.
In practice, these reforms dismantled protective barriers like tariffs and public ownership, allowing U.S. and European giants to dominate sectors such as mining, energy, and telecom. Favorable tax incentives and lax regulations enabled profit repatriation, often at the expense of local economies. The result? A cycle of dependency where nations remain debt-laden and revenue-starved, fueling the infamous “resource curse.”
Key takeaways from this era:
- Liberalization’s Double Edge: While it attracted foreign direct investment (FDI), it also facilitated capital flight, with trillions siphoned to tax havens.
- Data Snapshot: According to estimates from the Tax Justice Network and OECD, global corporate profits ballooned from ~$1,500 billion in 1995 to ~$7,500–8,200 billion in 2024, with 36% shifted to low-tax jurisdictions, leading to ~$492 billion in annual lost tax revenue.
The Human Cost of IMF Conditionality in Action
IMF loans come with strings attached—conditionalities like tax hikes, subsidy cuts, and privatization. These measures often spark inflation, unrest, and governance breakdowns. Let’s examine recent examples from Pakistan IMF bailout 2024, Sri Lanka economic crisis 2025, and Ghana debt restructuring 2022–2024.

Pakistan: Inflation and Political Turmoil
In 2024, Pakistan’s IMF program mandated agricultural taxation and energy price surges. Inflation hit ~38%, eroding purchasing power and igniting urban protests. Governance metrics worsened, with the Corruption Perceptions Index (CPI) dropping to 28/100 and Worldwide Governance Indicators (WGI) for government effectiveness plunging to -0.93.
Sri Lanka: From Crisis to Continued Struggle
The 2022–2025 IMF package enforced tax reforms and compliance measures, pushing inflation above 50%. Public backlash targeted the IMF for favoring fiscal targets over livelihoods. CPI fell to 34/100, and WGI effectiveness scored -0.62, amid gains for foreign firms in infrastructure.
Ghana: Subsidy Cuts and Economic Strain
Ghana’s 2022–2024 arrangement scaled back subsidies and wages, with inflation at 26–30%. CPI declined to 43/100, and WGI hit -0.34. Local reports highlighted elite capture and IMF-backed poverty under the banner of reform.
Across these nations, a pattern emerges: Conditionalities = Inflation + Unrest + Rising Corruption. Politicians decry the IMF, but the cycle persists, hollowing out middle classes and entrenching poverty.
The Mechanics of Corporate Profit-Shifting and Tax Evasion
At the heart of this system is a web of loopholes enabling multinationals to thrive while host countries suffer. Insights from the Panama Papers and Pandora Papers reveal how elites and corporations use offshore havens for ~8% of global wealth—trillions evading taxes.
- Transfer Pricing Tricks: Firms shift profits to low-tax zones, as detailed in EU reports on “Dirty Money and Tax Tricks.”
- Illicit Financial Flows (IFFs): Global Financial Integrity estimates show IFFs from developing countries at ~$1,100–1,600 billion in 2024, often rivaling FDI inflows.
- FATF’s Role: Anti-money-laundering rules, while necessary, disproportionately burden Global South financial systems, deepening reliance on IMF oversight.
Corporate Profits vs. Lost Revenues
| Year | Global Corporate Profits (USD bn) | Profit Shifted to Havens (%) | Lost Tax Revenue (USD bn) | Illicit Outflows from Developing Countries (USD bn) |
|---|---|---|---|---|
| 1995 | ~1,500 | ~25% | ~150 | ~200–400 |
| 2005 | ~2,900 | ~30% | ~250–300 | ~500–800 |
| 2015 | ~5,200 | ~36% | ~350–400 | ~800–1,200 |
| 2020 | ~6,800 | ~34–36% | ~420–470 | ~1,000–1,500 |
| 2024 | ~7,500–8,200 | ~36% | ~492 | ~1,100–1,600 |
(Source: OECD, Tax Justice Network, Gabriel Zucman estimates)
This table underscores how rising corporate wealth correlates with escalating tax losses, perpetuating debt cycles that draw countries back to the IMF.
Poverty, Inequality, and Governance Decline
Despite global poverty reductions from ~1.8 billion in 1995 to ~650–700 million in 2024 (Our World in Data), progress has stalled in IMF-program nations. Inequality remains stark, with top 10% income shares growing, while middle-class expansion falters.
Key Metrics Over Time
| Year | Extreme Poverty (millions) | Global Inequality (Top 10% Share/Gini Proxy) | Global CPI Average | WGI Government Effectiveness (Median) | Middle-Class Share (%) |
|---|---|---|---|---|---|
| 1995 | ~1.8 billion | Rising | ~3–4% | Mixed (pre-1996 data) | ~10–20% |
| 2005 | ~1.4 billion | Varying by region | ~3–4% | Slightly negative | ~25–30% |
| 2015 | ~702 million | Mixed, top incomes rebound | ~2–3% | Variable | ~30–35% |
| 2020 | ~700–750 million | Widened in many countries | ~3–4% | Pressures in fragile states | Stalled/reversed |
| 2024 | ~650–700 million | High, post-pandemic surge | Elevated in EMs | Declines in IMF countries | Uneven recovery |
(Source: Our World in Data, Financial Times, Transparency International, World Bank)
Governance and corruption often worsen during IMF programs, as seen in CPI and WGI trends for Pakistan, Sri Lanka, and Ghana.
Country-Specific Trajectories
| Country | IMF Program Years | CPI (Pre) | CPI (During) | CPI (2024) | WGI (Pre) | WGI (During) | WGI (2023/24) |
|---|---|---|---|---|---|---|---|
| Pakistan | 2023–2025 | ~32–35 | ~29–31 | 28 | ~–0.4 | ~–0.7 to –0.9 | –0.93 |
| Sri Lanka | 2022–2025 | ~38–40 | ~34–36 | 34 | ~–0.2 | ~–0.5 to –0.7 | –0.62 |
| Ghana | 2022–2024 | ~46–48 | ~44–45 | 43 | ~0.2–0.3 | ~0.0 to –0.2 | –0.34 |
(Source: Transparency.org, World Bank Databank)
Resource Exports vs. Capital Flight:
For commodity-dependent nations, exports generate billions, but IFFs and profit-shifting erode gains.
| Year | Resource Exports (USD bn) | FDI Inflows (USD bn) | Illicit Outflows (USD bn) | Net Pattern |
|---|---|---|---|---|
| 2005 | ~780 | ~170 | ~200–350 | IFFs > FDI |
| 2015 | ~1,050 | ~220 | ~400–700 | IFFs rising |
| 2020 | ~950 | ~180 | ~600–900 | Net flight |
| 2024 | ~1,100–1,300 | ~240–300 | ~700–1,100 | Leakage |
(Source: World Bank, OECD, Global Financial Integrity)
This imbalance explains recurring IMF dependencies.
Breaking the Cycle of Exploitation
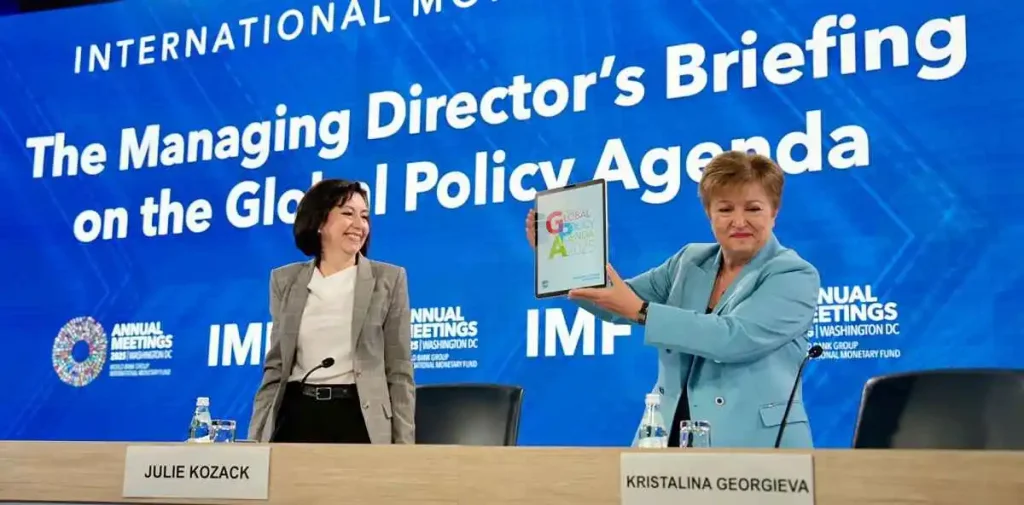
As debates rage at IMF-World Bank meetings, questions arise: Can the IMF shift from enabler to equitable partner? Alternatives like BRICS or AIIB challenge the status quo, while uprisings in Kenya, Bangladesh, and beyond signal growing discontent.
For sustainable change, prioritize people over profits: Reform conditionality to protect vulnerable groups, crack down on tax havens, and empower local governance. Without this, the Global South’s “Cromwellian Tide” of resistance may reshape the international financial landscape.


